Note
Go to the end to download the full example code.
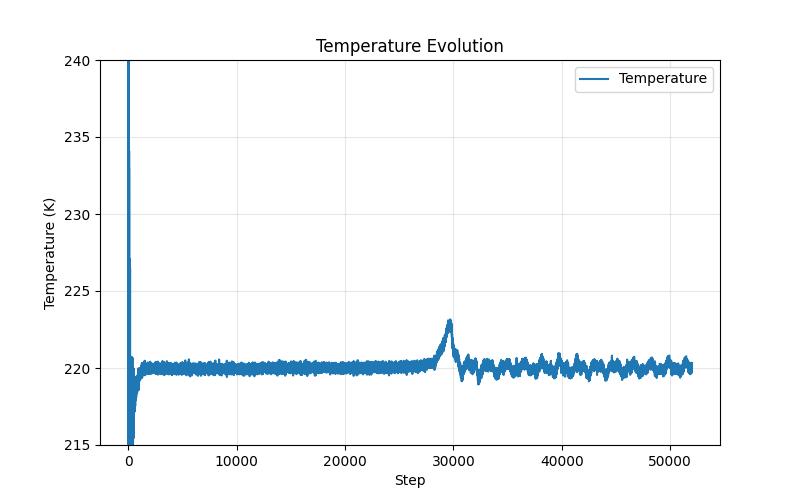
Basic Plotting
This example demonstrates how to read a LAMMPS log file and plot Temperature vs Step.
import matplotlib.pyplot as plt
import lammps_logfile
import os

# We use the included example file 'crack_log.lammps'
log_path = 'crack_log.lammps'

# Read the log file
data = lammps_logfile.read_log(log_path)

# Plot Temperature vs Step
plt.figure(figsize=(8, 5))
plt.plot(data['Step'], data['Temp'], label='Temperature')
plt.xlabel('Step')
plt.ylabel('Temperature (K)')
plt.title('Temperature Evolution')
plt.ylim(215, 240)
plt.legend()
plt.grid(True, alpha=0.3)
plt.show()
Total running time of the script: (0 minutes 0.474 seconds)