Getting started
Getting log data
from lammps_logfile import File

log = File("../../../examples/logfiles/crack_log.lammps")

t = log.get("Time")
temp = log.get("Temp")
Now the arrays t and temp contain the log data corresponding to the Time and Temp columns in the log file.
Plotting log data
import matplotlib.pyplot as plt

plt.plot(t, temp)
plt.xlabel("Time (ps)")
plt.ylabel("Temperature (K)")
plt.ylim([215, 225])
plt.savefig("time_temp.png")
To make the plot pop up in a window rather than being saved to a file, run plt.show() rather than plt.savefig(…).

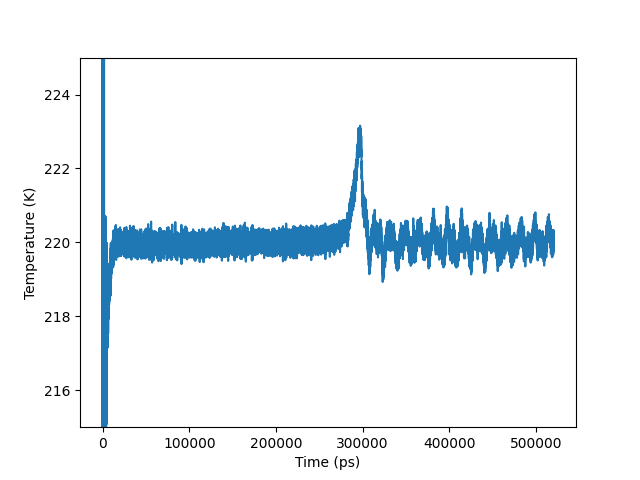
Plot of temperature vs. time
Running average
from lammps_logfile import running_mean

temp_avg = running_mean(temp, 100)

plt.plot(t, temp_avg)
plt.xlabel("Time (ps)")
plt.ylabel("Temperature (K)")
plt.ylim([215, 225])
plt.savefig("time_temp_avg.png")

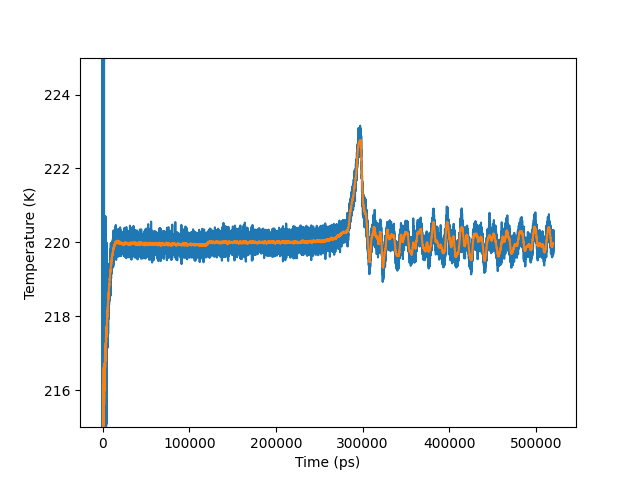
Plot of temperature vs. time. The blue curve is the raw output, whereas in the orange curve the temperature has been smoothed over a 100 log entries wide averaging window.
What data are available in the log file?
To inspect what columns are available, you can run the get_keywords-method on the File object:
print(log.get_keywords())
This command yields an output like the one below, which shows what columns we may get from the File object:
['Density', 'E_angle', 'E_bond', 'E_coul', 'E_dihed', 'E_impro', 'E_long', 'E_vdwl', 'KinEng', 'Lx', 'Ly', 'Lz', 'PotEng', 'Press', 'Pxx', 'Pxy', 'Pxz', 'Pyy', 'Pyz', 'Pzz', 'Step', 'Temp', 'Time', 'TotEng', 'methaneM', 'waterMsd']
Command line tool
The following is the help message from the command line tool lammps_logplotter that comes with lammps-logplotter. This tool is meant to quicky inspect lammps log files without having to write a python script.
usage: lammps_logplotter [-h] [-x X] [-y Y [Y ...]] [-a RUNNING_AVERAGE] input_file

Plot contents from lammps log files

positional arguments:
input_file            Lammps log file containing thermo output from lammps simulation.

optional arguments:
-h, --help            show this help message and exit
-x X                  Data to plot on the first axis
-y Y [Y ...]          Data to plot on the second axis. You can supply several names to get several plot lines in the same figure.
-a RUNNING_AVERAGE, --running_average RUNNING_AVERAGE
                        Optionally average over this many log entries with a running average. Some thermo properties fluctuate wildly, and often we are interested in te
                        running average of properties like temperature and pressure.